
Home values in the Chicago MSA may increase 9.0% over the next five years, to reach September 2005 levels.
SpringView Investments Fund II
SpringView Investments Fund II specializes in making houses into homes, and in evaluating the type and extent of renovation most likely to increase equity value and rent potential at the lowest investment for investors and home renters. We diligently evaluate each property, renovate and develop with skill, rent to families and individuals who might not otherwise be able to live in a home, and manage each property profesionally and locally.
TOP 3 REASONS WE LIKE CHICAGOLAND


The Numbers
The Neighborhoods
The Demographics
Chicago has rebounded from the ‘08 –’10 recession slower than other markets, based on employment and building permits, presenting opportunities for smart buyers.
Chicago has the third best housing fundamentals of all major housing markets. By 2018, it should remain above average, while most other major markets will fall below average.
Home values in the Chicago MSA increased 5.6% since August 2014; and may increase 9.0% over the next five years, to reach September 2005 levels.
With a rich real estate history, many people are attracted to the uniqueness of Chicago’s architecture, its beautiful skyline, ethnically diverse neighborhoods, and the city’s thriving business community.
Metropolitan Chicago boasts some of the most beautiful neighborhoods in the world.
SpringView has invested in some of the best-known neighborhoods, including Country Club Hills, Evergreen Park, Oak Park, and Oak Lawn.
Chicagoland also has positive demographic trends.
Only two major housing markets in the country are currently undervalued, according to John Burns Real Estate Consulting. Chicago is one of them, at (-7.00% (Atlanta, at -11.00% is the other.)
What's more, Chicago has strong occupancy rates for single-family homes, at 95%.
CHICAGO DEMOGRAPHICS
Source: US. Census American Community Survey 2008-2012. US. Bureau of Economic Analysis: John Burns Real Estate Consulting
City
Berwyn
Burbank
Calumet
Country Club
Evergreen
Glenwood
Hazelcrest
Homewood
Lansing
Matteson
Midlothian
Oak Forest
Olympia Fields
Park Forest
Richton Park
Romeoville
South Holland
Thornton
Zip Code
60402
60459
60409
60478
60805
60425
60429
60430
60438
60443
60445
60452
60461
60466
60471
60446
60473
60476
Population
56,657
29,124
37,070
16,854
19,852
9,033
14,341
19,526
28,270
18,692
14,788
27,922
4,283
22,424
13,568
39,175
21,944
2,338
Livability Index
74
75
72
72
74
75
71
75
70
75
76
79
78
75
72
73
76
75
Unem-ployment
Rate
NA
6.8%
12.8%
7.9%
8.1%
9.2%
13.1%
7.3%
7.7%
8.9%
9.9%
7.9%
5.4%
9.9%
10.4%
6.9%
10.0%
8.6%
Crime Index Rating
NA
A+
NA
NA
NA
A
NA
B
NA
NA
B+
NA
A+
B
B
A+
B+
A+
Median Housing Value
$216,200
$210,600
$122,400
$154,700
$214,500
$153,700
$138,200
$182,600
$143,600
$183,200
$169,800
$210,300
$263,000
$ 98,800
$168,600
$187,300
$169,100
$120,023
Median Household Income
$51,000
$56,617
$41,244
$61,944
$65,980
$57,092
$50,947
$69,835
$51,637
$66,847
$60,829
$69,048
$79,762
$47,062
$47,062
$70,541
$64,825
$54,673
Median Housing Value
$ 897
$1,010
$ 874
$1,459
$ 940
$ 988
$1,450
$ 984
$ 913
$1,173
$ 907
$ 959
$2,000
$ 929
$ 955
$1,288
$1,495
$ 729
Owner
Occupied Homes
60.5%
80.0%
59.1%
86.6%
81.8%
83.1%
65.9%
84.9%
74.2%
79.4%
74.2%
80.5%
87.8%
66.8%
63.5%
86.3%
89.4%
90.1%
Renter
Occupied Homes
39.5%
20.0%
40.9%
13.4%
7.2%
16.9%
34.1%
15.1%
25.8%
20.6%
25.8%
19.5%
12.2%
33.2%
36.5%
13.7%
10.6%
9.9%
Rental Vacancy Rate
6.3%
6.2%
9.6%
7.6%
7.2%
6.5%
8.6%
1.4%
3.4%
4.1%
9.6%
3.1%
NA
10.0%
13.4%
15.3%
8.6%
NA
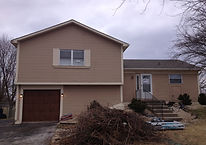
Before and After
SpringView evaluates the type and extent of renovation most likely to increase equity value and rent potential at the lowest investment. Here are three representative before and after snapshots of homes in the SpringView Investments Fund II portfolio:
PROPERTY ONE
Before

After

PROPERTY TWO
Before

After

PROPERTY THREE
Before
After

The Fund anticipates expanding to other high potential growth markets in the U.S, and to be a blend of Tier 1 and Tier 2 markets to maximize risk-adjusted returns.
Tier I markets exhibit leading population growth, extreme distress, and substantial discounts to replacement costs and attractive yields. They include Phoenix, Las Vegas, Atlanta and Charlotte. These are growth markets, with a high weighted average population growth in the past decade that experienced a significant revaluation during the housing crises.
Tier 2 markets feature many similar characteristics, but typically less distress, more stability and more modest pop-ulation growth. These include Chicago, Denver and Memphis. Tier 2 markets exhibit less volatility with solid growth potential.